HR Dashboard
Power BI and DAX code was utilised to create this Dashboard, developed using a Human Resources Data set obtained from Kaggle.
Steps taken in analysis:
- The data was extracted, transformed and loaded into Power BI using Power Query.
- A data model was then constructed in Power BI and relevant measures were formed using DAX code.
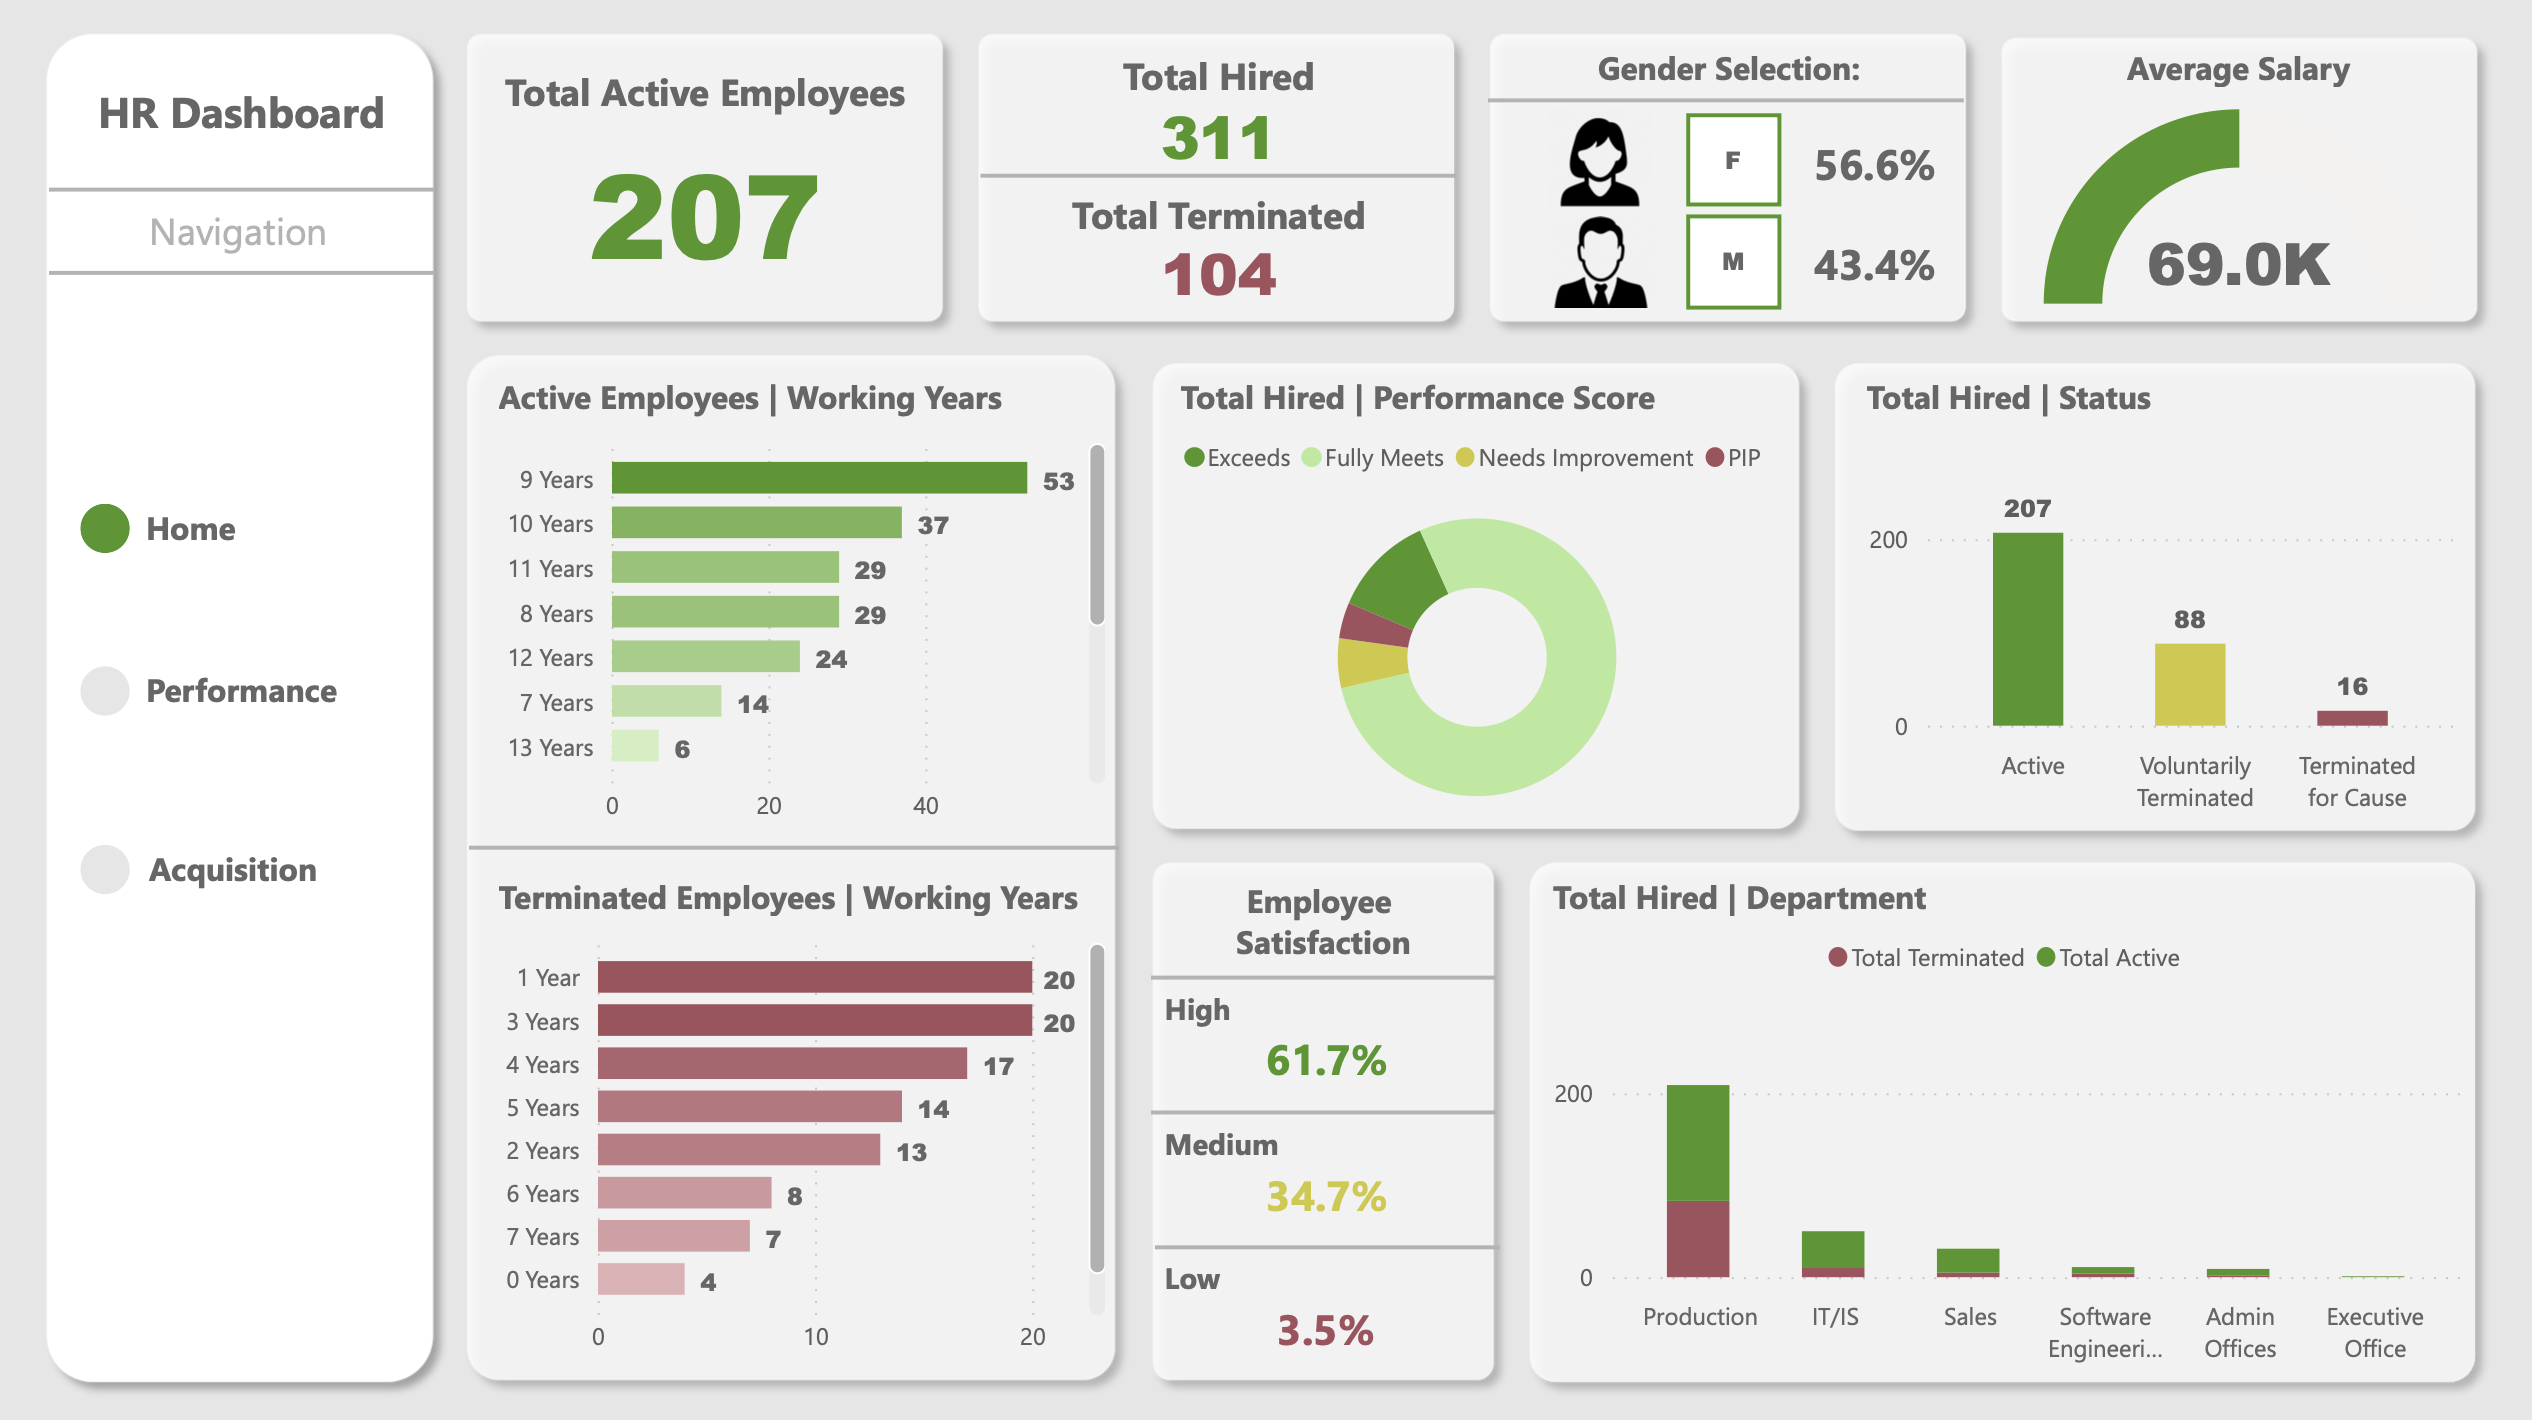
Home Page:
- Provides a comprehensive overview of the company, encompassing performance metrics, employee satisfaction levels, gender distribution, tenure, salary, and departmental breakdown.
Performance Page:
- Presents a detailed summary of different managers within the organisation, including the active employees under their supervision as well as terminated employees.
- This page features interactive filters to facilitate a more in-depth analysis, allowing users to explore specific manager names and departments.
Acquisition Page:
- This page offers insights into the organisation's recruitment strategies, including a breakdown of employees hired and terminated annually.
- Users can select different years for evaluation and assess the attrition rate for each year. Additionally, this page provides demographic information such as employee location and race.